Case Study

Figure.NZ data cards.
Introduction
My role at Figure.NZ involved experimenting with and implementing new ways of growing our reach. The goal of this was teaching New Zealanders from all backgrounds and education levels how to see their country clearly through data.
As well as delivering on Figure.NZ’s ongoing marketing, communications, and design needs, my key projects included the following.
Chart Embed Tool
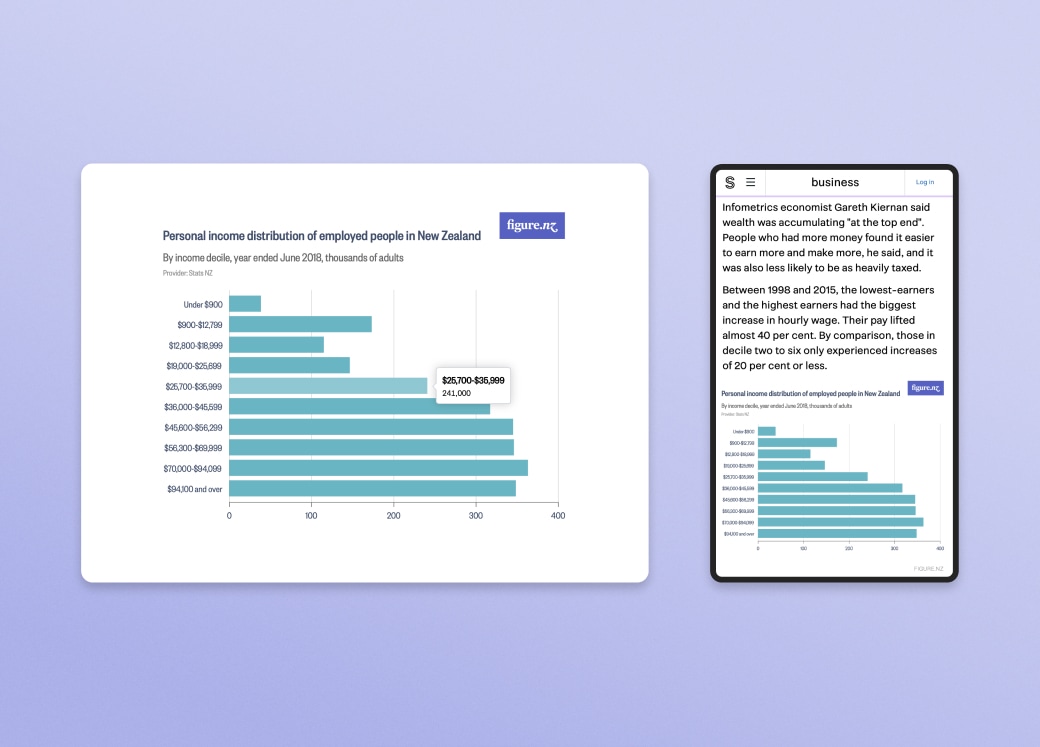
This was a web tool created in collaboration with editors and journalists at New Zealand’s leading news website. It allowed them to search the Figure.NZ site, find the chart they wanted, and copy and paste the embed code into their story with one click. This resulted in a beautifully rendered chart with functional interactivity, correct credits, and a link for readers to click through to Figure.NZ if they wanted to learn more. I was involved in the requirements gathering, adoption, and ongoing usage of this tool, leading to over 6 million chart views and more people seeing data in their day-to-day lives.
Data Stories
These were a new content type for sharing on social media: short, simple videos that dig into the data on a given topic and uncover a story along the way. The aim is to make data more human, interesting, and accessible by showing the stories that exist within it, and sharing the kinds of questions we can ask to help pull those stories out. I worked on these from concept through to execution, researching, sourcing, and interpreting data, writing scripts, designing and testing visual styles, and producing the final videos.
Data Cards
These were business cards that went beyond sharing contact details to showcasing a snapshot of interesting data about New Zealand. The fill-in-the-blanks format creates an opportunity for some light-hearted quizzing when meeting new people, as well as ideally teaching people something new about our country and prompting them to visit the Figure.NZ website to see what else they can find.
Chart Embed Tool

Chart embed tool: New Zealand’s money: How do you compare? (Stuff article)

Chart embed tool: Children born in NZ 1992-2017 (Stuff article)
Data Stories
Data stories: Teaser (Video)
Data stories: A Story About Our People (Video)

Data stories: stills.
Data Cards

Data card: fill-in-the-blanks.

Data card: contact details and answers.